Clouds of points
So far we have been able to define a set of points by hard-coding them in the formation of cube. Then we learned how to project them in 3D either using a simple orthographic projection or using the perspective formula. The effect of these projections became even more dramatic when we rotated them in real-time through the mouse movement. In this section we will spend some more time in describing ways of creating sets of points that are either results of a process (such a mathematical function) or are the output of a file (image, dxf file, or a database). These point-clouds can be manipulated in 3D to visualize or experiment with their formations.
Cosine Cloud
As we saw in the previous section we defined a point as an array of MyPoint objects:
points = new MyPoint[8];
points[0] = new MyPoint(0., 0., 0. );
points[1] = new MyPoint(100.,0., 0. );
points[2] = new MyPoint(100.,100.,0. );
points[3] = new MyPoint(0., 100.,0. );
points[4] = new MyPoint(0., 0., 100.);
points[5] = new MyPoint(100.,0., 100.);
points[6] = new MyPoint(100.,100.,100.);
points[7] = new MyPoint(0., 100.,100.);
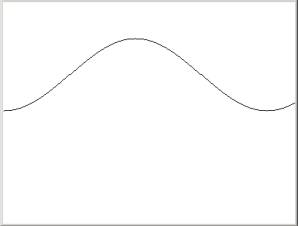
Instead of hard-coding those x, y, and z coordinates we can use a mathematical function to create them. Lets take the case of a cosine curve. Its 2D creation (see 2.3 of the book “2D Environmnets in Java”)involves a loop where the x variable becomes the changing angle and y becomes the cosine of the changing angle. The code is:
//*****************************************
public void paint(Graphics g){
for(int i=0; i<360; i++){
int x = i;
int y =
(int)(50. * Math.cos(Math.PI/180.* i)
);
g.drawString(".", x , y);
}
}
The result of this
implementation is:
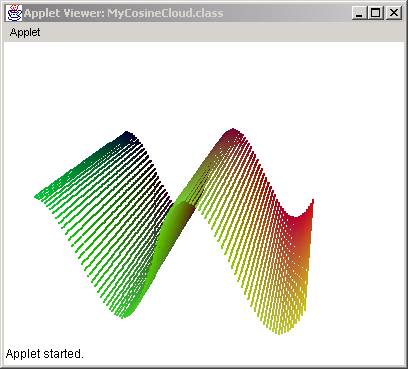
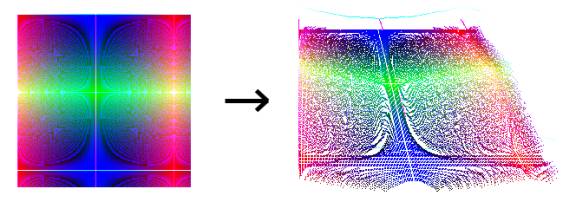
If we use the same logic but we assign z to be the cosine angle we will visualize the cosine as a z variation. In the following code we try to fill the points[] array with x, y , and z numbers that are the result of the cosine mathematical function. The x coordinate is the is the i-counter and the y coordinate is the j-counter. These counters simulate a 2D set of points (similar to an x by y grid). As they are incremented linearly they represent a regular grid if seen from above. But their z value is the cosine of one of the counters (i.e. i). In the following source code we show the main loop that fills in the points array:
for(int i=0; i<width; i++)
for(int j=0; j<height; j++){
int c1 = i*2; // double the width range
int c2 = j*2; // double the height range
int c3 = (int)(50. * Math.cos(Math.PI/180. * (i * 6)));
points[i*height+j]=new MyPoint((double)c1,(double)c2, (double)c3);
c3 = Math.abs(c3); //cosine may be negative!
points[i*height+j].setColor(new Color(c1, c2, c3));
}
In the above code we also paint each point with a color in order to show the z values with a related color. Normally, we would just set the color to black. The full source code that allows rotation and double buffering is shown below:
import java.applet.*;
import java.awt.*;
import java.awt.image.*;
public class MyCosineCloud extends Applet{
MyPoint[] points;
int xf, yf;
Graphics offGraphics;
Image offImage;
int width = 100, height = 100;
//**********************
public void init(){
//*** initialize double buffering
offImage = createImage(800, 600);
offGraphics = offImage.getGraphics();
//*** allocate memory for the points array
points = new MyPoint[width*height];
//*** fill the points array
for(int i=0; i<width; i++)
for(int j=0; j<height; j++){
int c1 = i*2; // double the width range
int c2 = j*2; // double the height range
int c3 = (int)(50. * Math.cos(Math.PI/180. * (i * 6)));
points[i*height+j] = new MyPoint((double) c1,
(double) c2, (double) c3);
c3 = Math.abs(c3); //cosine may be negative!
points[i*height+j].setColor(new Color(c1, c2, c3));
}
//*** move to the center of rotation
for(int i=0; i<points.length; i++)
points[i].move(-50., -50.,-50.);
}
/*********************/
public void paint(Graphics g){
offGraphics.setColor(Color.white);
offGraphics.fillRect(0,0,800, 600);
offGraphics.setColor(Color.black);
for(int i=0; i<points.length; i++){
MyPoint p = points[i].setPerspective();
offGraphics.setColor(points[i].color);
offGraphics.fillRect((int)p.x+width+50, (int)p.y+height, 2, 2);
}
// draw the buffer
g.drawImage(offImage, 0, 0, this);
}
//************************************************
public boolean mouseDown(Event e, int x, int y){
xf = x;
yf = y;
return true;
}
//************************************************
public boolean mouseDrag(Event e, int x, int y){
int xoff = x - xf;
int yoff = y - yf;
for(int i=0; i<points.length; i++){
points[i].rotatex(xoff*Math.PI/180);
points[i].rotatey(yoff*Math.PI/180);
}
repaint();
xf = x;
yf = y;
return true;
}
}
The result is:
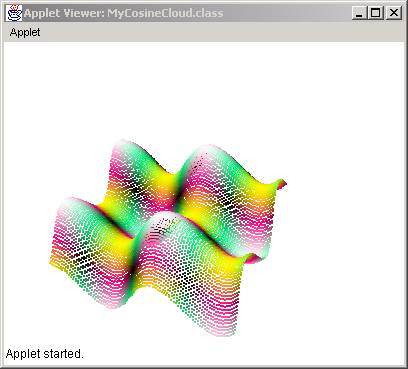
Many alterations can be done to this algorithm of creating points. For example, the following alternative produces a different pattern, which may be predictable to those who know the behavior of sines and cosines.
//*** fill the points array
for(int i=0; i<width; i++)
for(int j=0; j<height; j++){
int c1 = (int)(50. * Math.cos(Math.PI/180. * (i * 6)));
int c2 = (int)(50. * Math.sin(Math.PI/180. * (j * 6)));
int c3 = (c1 + c2)/2;
points[i*height+j] = new MyPoint((double)i*2, (double)j*2,
(double) c3);
c1 = 5*Math.abs(c1); //co/sine may be negative!
c2 = 5*Math.abs(c2); //co/sine may be negative!
c3 = 5*Math.abs(c3); //co/sine may be negative!
points[i*height+j].setColor(new Color(c1, c2, c3));
}
The result is:
Predictability of Outcome
The objective of this section was to fill the points array using the result of a mathematical function. In some cases, we are able to predict the result of the algorithms but in other cases it is impossible and the resulting cloud is often surprising. The complexity of the algorithm is not necessarily an indicator of its unpredictability. As we saw in 2D mathematical images, we can create complex patterns with simple algorithms and vice versa we can create simple patterns through complicated algorithms.
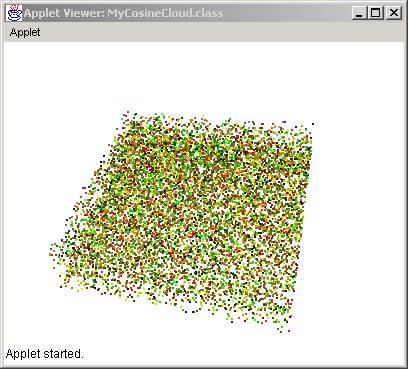
Random-generated Cloud
The simplest case of a mathematical function would be a random function. Here we assign a z height to be a random number between 0 and 50. We also create random numbers between 0 and 255 to create random colors. The source code would look like:
//*** fill the points array
for(int i=0; i<width; i++)
for(int j=0; j<height; j++){
int c1 = (int)(255. * Math.random());
int c2 = (int)(255. * Math.random());
int c3 = (int)(50. * Math.random());
points[i*height+j] = new MyPoint((double) i*2, (double) j*2,
(double) c3);
points[i*height+j].setColor(new Color(c1, c2, c3));
}
and the resulting cloud would look like this:
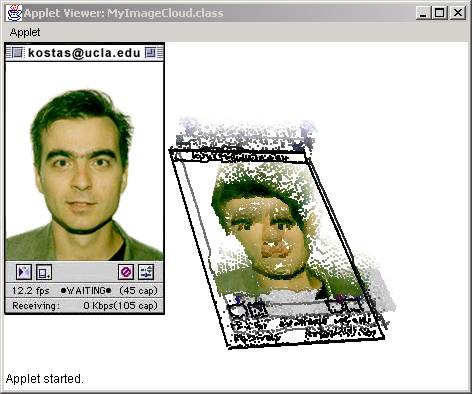
ImageCloud
What if we want to display data that are coming from a file/image instead of generating them on the fly through mathematical functions. In the next section we will outline the process of extracting the colors of an image and then using those color numbers to assign z-heights. To do this we need to do the following:
- Open a file (in this case we will use an image file)
- Read the pixels one by one
- Assign their value to the z-height
For the purpose of this example we will need to introduce two new java objects: a java.awt.image.BufferedImage and a java.awt.image.ColorModel. A BufferedImage is a copy of an image in which we have access to the values of the pixels. In the case of a simple Image object we are able to display the image but we have no accrees to its pixels. So we use the BufferedImage instead. Once we get the value of a pixel that will be in the format of a 32-bit integer number, where the first 8 bits is the alpha channel and the remaining 8, 8 and 8-bits are the values of the Red, Green, and Blue respectively (see section 8.1 of the book “2D Environments in Java”). To avoid doing bit-manipulations to extract the values of each color for the pixel integer we use the ColorModel’s methods getRed(pixel), getGreen(pixel), and getBlue(pixel). Here is the code:
import java.awt.*;
import java.awt.image.*;
import java.applet.*;
import javax.swing.*;
public class MyImageCloud extends Applet{
int xp, yp;
MyPoint[] points;
Image offImage;
Graphics offGraphics;
Image picture;
BufferedImage bpicture;
Graphics2D big;
/**
* DESCRIPTION
*
* @author DEVELOPER
* @since 1.0 (1/15/01)
************************************/
public void init(){
offImage = createImage(800, 600);
offGraphics = offImage.getGraphics();
picture = getImage(getDocumentBase(), "face.jpg");
try{
MediaTracker tracker = new MediaTracker(this);
tracker.addImage(picture, 0);
tracker.waitForID(0);
}
catch(Exception e){ }
int iw = picture.getWidth(this);
int ih = picture.getHeight(this);
bpicture = new BufferedImage(iw, ih,BufferedImage.TYPE_INT_RGB);
big = bpicture.createGraphics();
big.drawImage(picture, 0, 0, this);
ColorModel cm = ColorModel.getRGBdefault();
points = new MyPoint[iw*ih];
for(int i=0; i<iw; i++)
for(int j=0; j<ih; j++){
int c3 = bpicture.getRGB(i,j);
points[i*ih+j] = new MyPoint((double) i,
(double) j,
(double)cm.getBlue(c3)/5);
points[i*ih+j].setColor(new Color(cm.getRed (c3),
cm.getGreen(c3),
cm.getBlue (c3)));
}
for(int i=0; i<points.length; i++)
points[i].move(-100., -100., -100.);
repaint();
}
//*******************
public void paint(Graphics g){
offGraphics.setColor(Color.white);
offGraphics.fillRect(0,0,800, 600);
offGraphics.setColor(Color.black);
for(int i=0; i<points.length; i++){
MyPoint p = new MyPoint(0.,0.,0.);
p = points[i].setPerspective(1024.);
int xpos = (int)p.x + 300;
int ypos = (int)p.y + 100;
offGraphics.setColor(points[i].color);
offGraphics.drawRect(xpos, ypos, 1, 1);
}
offGraphics.drawImage(picture, 0, 0, this);
g.drawImage(offImage, 0, 0, this);
}
//*********************
public boolean mouseDown(Event e, int x, int y){
xp = x;
yp = y;
return true;
}
//*******************
public boolean mouseDrag(Event e, int x, int y){
int xoff = x - xp;
int yoff = y - yp;
for(int i=0; i<points.length; i++){
points[i].rotatey(xoff * Math.PI/180.);
points[i].rotatex(yoff * Math.PI/180.);
}
repaint();
xp = x;
yp = y;
return true;
}
}
As you can see in the init() method we use both BufferedImage and ColorModel. Before we go through each step we need to mention here that the code:
try{
MediaTracker tracker = new MediaTracker(this);
tracker.addImage(picture, 0);
tracker.waitForID(0);
}
catch(Exception e){ }
is just a simple way of making sure that the images to be read are indeed read. Sometimes when reading an image there is a chance that the image is not complete or that the system stopped while reading the image so these six lines of code ensure that there is an image.
After we read the image we extract its height (ih) and width (iw):
int iw = picture.getWidth(this);
int ih = picture.getHeight(this);
We need these two variables in order to allocate memory for the BufferedImage object:
bpicture = new BufferedImage(iw, ih, BufferedImage.TYPE_INT_RGB);
A BufferedImage needs a width, a height and a type of data (in this case RGB). Then we create a Graphics object related to that BufferedImage.
big = bpicture.createGraphics();
Then we draw the image on the newly created Graphics associating the BufferedImage with the Image. From now on any pixel of the Image is also a pixel of the BufferedImage.
big.drawImage(picture, 0, 0, this);
Then we create a color model using the default RGB extractor:
ColorModel cm = ColorModel.getRGBdefault();
This color model becomes useful when we want to extract the RGB values from the pixels of the image:
points[i*ih+j].setColor(new Color(cm.getRed(c3),
cm.getGreen(c3),
cm.getBlue(c3)));
Then we create MyPoint objects using i and j as the x and y and the value of blue or the color of the pixel for the z- height.
int c3 = bpicture.getRGB(i,j);
points[i*ih+j] = new MyPoint((double)i,
(double)j,
(double) cm.getBlue(c3)/5);
The result for the image file (shown in the left) is:
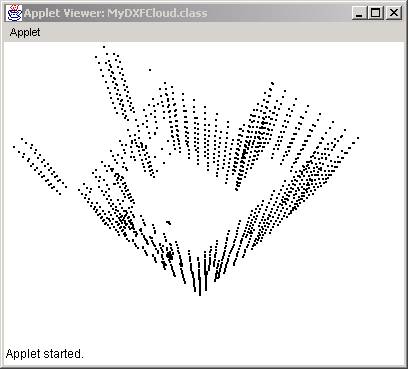
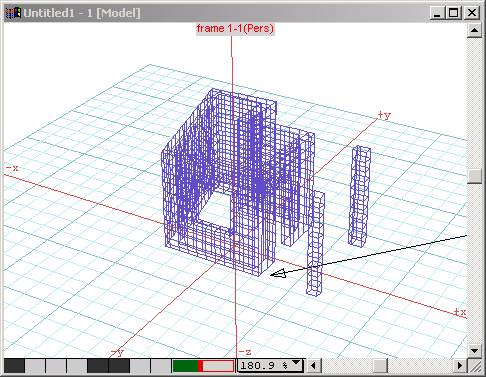
DXF Cloud
In the following section we will show how to fill the points array with data points that come from a DXF file. As we already saw in Chapter 5 of the book “2D Environments in Java”, we can read and write 2D information from DXF files. In this case all we need to do is read just the points. No connections, no POLYLINEs. To demonstrate the method, we first need a DXF file. So we create a simple structure in a modeling program (in our case we use formZ) and then we save it as a file called “struct.dxf”.
Then we create a class called MyFile (based on the MyFile of Chapter 5 of the book “2D Environments in Java”), where we will read a DXF file. As we already know DXF code for x, y and z coordinates is 10, 20, and 30 . So when we see a sequence that looks like this:
…
10
100.0
20
100.0
30
0.0
…
this describes a point with coordinates (100.0, 100.0, 0.0). So to extract the 10, 20, 30 sequences we nee to loop through the whole file and look for those numbers. When we encounter a 10 we go to the next line and get the x coordinate , then two lines further is the y coordinate and two lines further is the z coordinate. Here is the code:
import java.io.*;
import java.util.*;
public class MyFile {
/**********************************************************/
public MyPoint[] readDXFFile(String fileIn) throws IOException
{
Vector vpoints = new Vector();
System.out.println("Reading DXF file " + fileIn + "...");
FileInputStream is = new FileInputStream(fileIn);
DataInputStream file = new DataInputStream(is);
StreamTokenizer st = new StreamTokenizer(is);
st.eolIsSignificant(true);
st.wordChars(' ','_');
boolean exit = false; //flag to exit
double x = 0.;
double y = 0.;
double z = 0.;
while (true) {
if(exit) break;
st.nextToken();
switch (st.ttype) {
case StreamTokenizer.TT_EOF:
exit = true;
break;
case StreamTokenizer.TT_NUMBER:
if (st.nval == 10){
if(st.nextToken() == StreamTokenizer.TT_EOL)
if (st.nextToken() == StreamTokenizer.TT_NUMBER)
x = st.nval;
if(st.nextToken() == StreamTokenizer.TT_EOL)
if (st.nextToken() == StreamTokenizer.TT_NUMBER)
if(st.nextToken() == StreamTokenizer.TT_EOL)
if (st.nextToken() == StreamTokenizer.TT_NUMBER)
y = st.nval;
if(st.nextToken() == StreamTokenizer.TT_EOL)
if (st.nextToken() == StreamTokenizer.TT_NUMBER)
if(st.nextToken() == StreamTokenizer.TT_EOL)
if (st.nextToken() == StreamTokenizer.TT_NUMBER)
z = st.nval;
vpoints.addElement(new MyPoint(x, y, z));
}
break;
default:
break;
} /* switch */
} /* while */
System.out.println("Finished ");
int numPoints = vpoints.size();
MyPoint[] points = new MyPoint[numPoints];
for(int i=0; i<numPoints; i++)
points[i] = (MyPoint)vpoints.elementAt(i);
file.close();
return points;
}
}
Since we do not know how many points we will encounter we use a Vector structure which we call vpoints to hold the points. When we are done, create and array of points and we return it.
In the main code, all we need to do is replace the init() method with a call to the MyFile.readDXF
//**********************
public void init(){
//*** initialize double buffering
offImage = createImage(800, 600);
offGraphics = offImage.getGraphics();
//*** read a file to fill the points array
MyFile file = new MyFile();
try{
points = file.readDXFFile("struct.dxf");
}
catch(IOException ioe){ }
//*** move to the center of rotation
for(int i=0; i<points.length; i++)
points[i].move(-50., -50.,-50.);
}
Here is the result: